Pterodactyl Node Capacity: Stop Wasting Game Hosting Resources
A practical capacity planning guide for game server hosting owners using Pterodactyl, covering node limits, resource fragmentation, safe overcommit tests, and monitoring.
Author
Yuvraj Verma
Written as a practical guide, not just a summary.

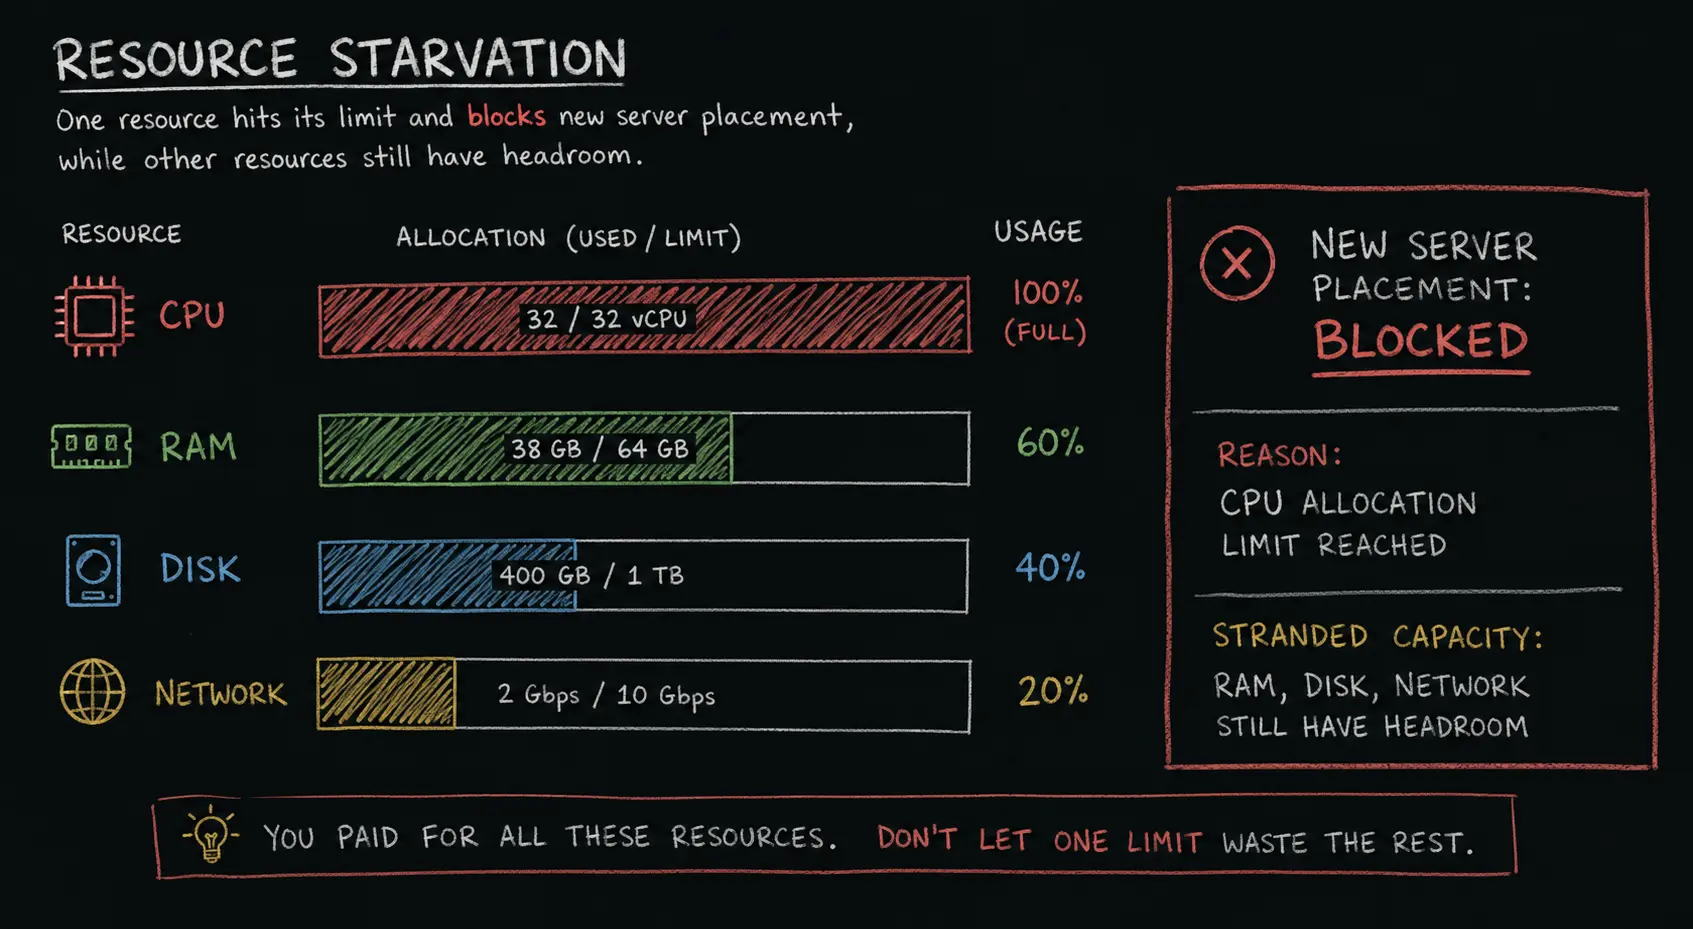
You open htop on your Pterodactyl node. The machine still has memory available. Your panel, billing module, or setup script refuses to create another customer server on it. New signups go to the waitlist even though the machine is not actually full.
Hosts often call that gap resource starvation.
If we are being more technical, it is usually resource fragmentation or stranded capacity. The node is not empty. It is also not safely full. One resource is blocking new servers while another resource is sitting unused. For a Pterodactyl-based game hosting business, this is where profit quietly disappears.
Quick answer
This guide is written for game server hosting owners, especially people using Pterodactyl with WHMCS, Paymenter, Wisp, or custom automation. I use "resource starvation" the way hosting people often use it: paid resources are left unused because another limit blocks new servers. The more precise term is resource fragmentation or stranded capacity.
I want to explain how Pterodactyl node capacity really behaves, why simple plan math fails, how to test overcommit safely, and when you should stop trying to squeeze the node and buy more capacity.
The Capacity Problem Hosting Owners Hit
Every game server consumes multiple resources at the same time:
- CPU for game ticks, scripts, physics, AI, plugins, and world simulation
- RAM for heap, world data, mods, scripts, cache, and player state
- Disk for worlds, databases, logs, backups, and mod files
- Network for player traffic, query traffic, downloads, and DDoS exposure
Most beginners only think in two dimensions: CPU and RAM. That is enough to understand the core problem, but remember that disk and network can block growth too.
Your node has a limit for each resource. Your panel or billing system keeps adding servers until one limit is reached. Once one limit is reached, new server creation can stop even if another resource still has room.
That is why the technically correct phrase is resource fragmentation. You still have capacity, but it is not available in the right shape for the next server plan.
Here is the simple version:
| Starvation pattern | What you see | What gets wasted |
|---|---|---|
| CPU allocation blocks placement | CPU allocation is full, but real RAM usage is still comfortable | RAM, disk, and sometimes network capacity |
| RAM allocation blocks placement | RAM allocation is full, but real CPU usage is still comfortable | CPU capacity |
| Disk allocation blocks placement | Disk is fully allocated, but CPU and RAM are fine | Compute capacity |
| Network or DDoS limit blocks growth | Node resources look fine, but traffic or attack risk is high | The rest of the node |
One important Linux detail: do not look only at "free" memory in htop. Linux uses RAM for cache, so "free RAM" can look confusing. For capacity decisions, look at available memory, swap usage, and each container's memory usage over time. "Free RAM" and "safe RAM headroom" are not always the same thing.
How Pterodactyl Sees Node Capacity
People often call this "Pterodactyl scheduling," but that is not exactly how Pterodactyl works.
Pterodactyl does not have a "brain" that understands your node the way a human operator does. You add a node, tell Pterodactyl how much memory and disk it should treat as available, and then it follows those numbers. If you tell it the node has 64GB RAM available for servers, it will keep treating that configured number as the limit.
This matters because Pterodactyl's node capacity logic is mostly allocation-based, not live-usage-based. The node has configured memory and disk values. It also has memory and disk overallocate values. When Pterodactyl checks whether a node can fit another server, the important question is usually:
"Does this node still have enough allocated memory and allocated disk left for the new server?"
Example: if a node is configured with 64GB RAM and 0% memory overallocate, Pterodactyl treats 64GB as the memory allocation limit. If you set memory overallocate to 20%, it can treat that node as having 76.8GB of allocatable memory. That does not mean the machine magically has more RAM. It only means you allowed more customer memory limits to be assigned than the physical RAM number.
That is different from asking:
"Are the existing servers actually using all their RAM and disk right now?"
Those are not the same question.
Pterodactyl does set per-server limits too. When you create or update a server, the build limits include memory, swap, disk, IO weight, CPU percentage, CPU threads, and OOM behavior. Wings then runs the game server in Docker using those configured limits. But Pterodactyl is still following your configured limits. It is not automatically studying your real customer usage and rebalancing the node for you.
Allocations are another common point of confusion. In Pterodactyl, an allocation means an IP and port pair that can be assigned to a server. It is not the same thing as RAM allocation or CPU allocation.
So when I say "the scheduler refuses to place another server," read it as: your setup refuses to create another server because of the memory, disk, package, or automation rules you configured.
The fix may be in a different place:
- Pterodactyl node memory or disk over-allocation settings
- WHMCS or Paymenter package limits
- a custom setup module
- plan design, such as selling too much CPU with too little RAM
- operational policy, such as reserving capacity for migrations or spikes
Why This Matters for Game Hosting Owners
If you run your own community server, starvation is annoying. You resize the VPS, move worlds around, or buy a better machine.
If you are running a game server hosting business, starvation means wasted money. You paid for the hardware, power, network, IPs, licenses, and support time. But part of that hardware cannot be sold because your plan rules boxed it in.
The beginner math usually looks like this:
"I have 32 vCPUs and 64GB RAM. I will sell 32 plans with 1 vCPU and 2GB RAM each."
On paper, that is perfect. In production, it is rarely perfect.
A Minecraft server sold with 2GB RAM might idle at 700MB and peak at 1.4GB. A FiveM server sold with 1 vCPU might sit quietly for most of the day, then hammer one core during peak roleplay hours. Allocated resources are the limits you sold. Actual usage is what the customer really uses.
The business lives in the gap between allocated and actually used.
That gap is what makes overselling possible. Done correctly, overselling is not scamming customers. It is capacity planning. Done lazily, it becomes the fastest way to create lag, support tickets, and cancellations.
Calculated Overselling Without Burning Customers
Overselling means selling more allocated capacity than the physical machine has, because customers usually do not all hit their limits at the same time.
The keyword is measured.
Without measurements, overselling is guessing. With measurements, it becomes a business decision.
Step 1: Measure Actual Usage, Not Sold Plans
Before changing ratios, collect real usage data from the nodes and containers.
You want to know:
- node CPU usage during peak hours
- per-container CPU usage during peak hours
- node memory available, not just free memory
- per-container memory usage compared to its limit
- swap usage, swap-in and swap-out activity, and memory pressure metrics
- disk usage and signs that storage is getting slow
- network throughput, packet drops, and DDoS-related events
Good starting tools:
- Netdata for fast node-level and container visibility
- Prometheus + Node Exporter for host metrics and longer history
- cAdvisor + Prometheus for container-level CPU and memory metrics
- Grafana for dashboards, trend views, and alert review
Netdata is the easiest starting point. Prometheus, Node Exporter, cAdvisor, and Grafana are better when you want longer history and cleaner dashboards across multiple nodes.
Nonzero swap usage alone does not prove the node is under pressure right now. Swap can remain used after an older spike. What matters more is sustained swap-ins, swap-outs, reclaim stalls, rising memory pressure, memory PSI if your monitoring stack exposes it, and customers hitting their memory limits.
Run monitoring for at least 2-4 weeks before changing your oversell ratios. This is only a starting point. If your traffic is seasonal, weekend-heavy, or affected by game updates, you need a longer window. The average will look comfortable. Busy evenings, weekends, updates, backups, and restarts are where customers feel pain.
Step 2: Use Busy-Hour Demand, Not Simple Averages
Your safe oversell room is not based on average usage. Averages hide spikes. But using one random maximum can also mislead you, because one weird event can make the number look worse than normal.
For a beginner, use this approach:
- look at busy-hour usage, not quiet afternoon usage
- check p95 or p99 usage if your monitoring tool supports it
- keep a safety buffer for the OS, Wings, Docker, backups, updates, and mistakes
- add capacity slowly, then watch what happens
Example:
| Metric | Value |
|---|---|
| Physical RAM | 64GB |
| Keep for OS, Docker, Wings, and cache | 6GB |
| Safety buffer | 8GB |
| Usable RAM for customer servers | 50GB |
| Current busy-hour RAM usage | 42GB |
| Room before the safety line | 8GB |
| Typical busy-hour RAM used by one new 2GB plan | 900MB |
| Theoretical extra servers | about 8 |
In that example, the math says you might have room for about 8 more small servers. That does not mean you instantly add 8. A safer move is adding 3 or 4, watching the node during real peak hours, and then adjusting again.
Also notice that this is based on actual busy-hour demand, not the 2GB plan limit. That is the whole point. You are not asking "how much did I sell?" You are asking "how much do these servers really use at the same time?"
This calculation assumes the new servers have a similar workload mix and busy-hour usage pattern to the servers used to derive the 900MB figure. If the next customers are heavier modpacks, larger FiveM servers, or different games entirely, the estimate changes.
Golden rule
Never set oversell ratios from average usage alone. Use busy-hour or high-percentile usage, leave a buffer, and move ratios gradually. If customers notice the experiment before your dashboard does, the experiment was too aggressive.
Step 3: Fix the Resource That Blocks Placement
This is the part people often get backwards.
If CPU allocation is blocking new servers, but real CPU usage still has room, the useful move is usually a small CPU overcommit or a plan change. Overcommit just means you allow the panel or billing system to sell a little more than the physical limit because real usage is lower. That can unlock the RAM that was stuck unused.
If RAM allocation is blocking new servers, but representative peak measurements show substantial RAM headroom with no active memory pressure, a small, reversible RAM-overcommit experiment may be reasonable. That can unlock the CPU that was stuck unused.
Do not oversell the "other" resource just because it is leftover. Adjust the resource that is blocking new servers, but only if your real usage data proves that resource has room.
| Pattern on a loaded node | What it means | Safer action |
|---|---|---|
| CPU allocation full, real CPU remains comfortable, and game health is clean | CPU allocation may be too strict for this customer mix | Raise CPU overcommit slowly or sell less CPU per plan |
| CPU allocation full, CPU pressure is visible in latency, per-core usage, TPS, or hitch warnings | CPU is genuinely pressured | Do not oversell CPU. Move workloads or add capacity |
| RAM allocation full, real memory remains comfortable, and there is no active swap or memory pressure | RAM allocation may be conservative | Raise RAM overcommit slowly |
| RAM allocation full, memory pressure is visible through limit hits, sustained swap activity, or stalls | RAM is genuinely pressured | Do not oversell RAM. Move workloads or add capacity |
| Disk allocation full, disk use low | Disk allocation is conservative | Raise disk overcommit only if backups/logs are controlled |
| Disk feels slow or wait time is high | Storage is the real bottleneck | Fix storage before selling more plans |
Step 4: Move Slowly
Start with small, reversible changes. Do not jump to aggressive ratios because a table on the internet said some servers idle low.
Use measurements to choose the first experiment:
| Observed condition | Possible initial experiment |
|---|---|
| No representative peak data | Do not overcommit yet |
| Clear CPU headroom and healthy game metrics | Test a 5-10% CPU allocation increase |
| Clear RAM headroom with no active memory pressure | Test up to a 5-10% RAM allocation increase |
| New or substantially different workload mix | Measure separately first |
| Any deterioration in game health | Roll back |
These figures are included only to illustrate the size of a gradual experiment. They should not be copied as starting ratios without measurements from your own fleet.
CPU and RAM Overcommit Are Not Equally Risky
CPU and RAM behave differently when you oversell them.
CPU is usually more forgiving. If too many servers want CPU at the same time, the result is usually slower execution, lag spikes, bad tick rate, hitch warnings, or console delay. That is still bad, but the machine usually stays alive.
RAM is less forgiving. If too many servers actually need memory at the same time, Linux has fewer nice options. It may reclaim cache, use swap, stall processes, or kill a container with an out-of-memory error. Docker's own docs warn that running out of memory can cause the kernel to kill processes, and the wrong kill can make the whole host unstable.
So be more conservative with RAM than CPU. A small amount of CPU overcommit can be normal. RAM overcommit needs tighter monitoring, a bigger buffer, and a clear rollback plan.
Simple rule
CPU overcommit usually hurts performance first. RAM overcommit can kill processes. Treat RAM overselling with more caution.
Where Overselling Goes Wrong
Overselling usually fails for one of four reasons.
You Optimized for Margin Before Stability
New hosting businesses often try to make the first node profitable immediately. That is understandable, but dangerous.
Your first node teaches you your real customer behavior. If you oversell heavily before learning the behavior, you are using paying customers as the monitoring system.
You Ignored Time of Day
Game servers are not evenly loaded. A node that looks empty at 2pm can become ugly at 10pm. Weekend peaks are different from weekday peaks. Summer vacation traffic is different from exam season traffic.
Look at the busiest hours your customers actually play.
You Mixed Heavy and Light Workloads Randomly
A node with 20 small Minecraft servers behaves differently from a node with 8 heavy FiveM RP servers. If you mix everything randomly, one bad customer server can distort the whole node.
Group similar workloads where possible:
- light Minecraft and small SMPs together
- heavy modpacks on stricter RAM policies
- FiveM RP servers on CPU-strong nodes
- development/test servers away from serious customer servers
You Had Alerts After the Damage
An alert at 98% RAM is not an alert. It is a confession.
Good alerts warn you while there is still time to migrate, throttle, upgrade, or contact the customer.
You Confused Node Headroom With Fleet Headroom
Node headroom and fleet headroom are separate.
A single node can have enough room for normal daily spikes and still leave you in trouble if another node needs maintenance. If you promise migrations, emergency moves, or any kind of failover, reserve enough capacity across other nodes to absorb the failure scenario you actually promise to handle.
For a small host, that promise might be simple: "I can manually move a few important servers during maintenance." For a larger host, it may mean keeping enough spare capacity across the fleet to survive one node going offline. Either way, do not spend every bit of spare capacity on new sales.
Alerts a Hosting Business Actually Needs
Start simple. You can make alerts more precise later.
The percentages below are warning lights, not laws. A node can show 60% total CPU while one important core is maxed out. A node can show high RAM usage but still be fine if most of it is easy-to-free cache. Always combine node metrics with game health, like Minecraft TPS, FiveM hitch warnings, player complaints, and restart patterns.
Node CPU above 80% for more than 5 minutes
Short spikes are normal. Sustained pressure means customers may start feeling tick drops, console lag, or script delays. Also check per-core usage, because many game servers care more about one busy core than total CPU across the whole machine.
Node RAM above 85%
This is where you should already be paying attention. High RAM usage is not always bad if Linux is using memory for cache, but swap activity, rising memory pressure, or containers hitting their limits are danger signs.
Per-container RAM above 90% of allocation
This is both a support signal and an upsell signal. The customer may need a bigger plan, a plugin cleanup, or better JVM flags.
Per-container CPU pinned for more than 2 minutes
One server hitting its ceiling is different from the whole node being overloaded. Per-container visibility keeps you from blaming the wrong thing.
Disk usage above 80% and storage getting slow
World backups, logs, crash dumps, and databases can fill disks faster than expected. Also separate disk space from disk performance. A disk can have free space and still be too slow during backups, world saves, or database writes.
Packet loss, jitter, or network drops
A game server can have perfect CPU and RAM and still feel terrible if packets are dropping or latency is unstable. For game servers, jitter can be just as painful as raw packet loss.
Monitoring Stack Recommendation
You do not need the perfect monitoring setup on day one. You need enough visibility to avoid blind decisions.
Starting Out: 1-3 Nodes
Install Netdata on each node. It gives you fast live visibility and is usually enough to spot obvious CPU, RAM, disk, and container issues while you are learning your traffic.
Also keep a simple spreadsheet:
- node name
- CPU model
- RAM
- disk
- plan mix
- sold resources
- peak actual usage
- major incidents
This sounds basic because it is. Basic is useful.
Growing: 4-10 Nodes
Add Prometheus, Node Exporter, cAdvisor, and Grafana.
At this stage you want historical data, not just live charts. You should be able to answer:
- Which node peaks first every evening?
- Which customer servers consistently hit limits?
- Which game type produces the most support tickets?
- Which plan has the worst margin after real usage?
The goal is not more charts. The goal is fewer surprises.
Starvation Profiles of Common Game Servers
These are practical patterns, not laws.
| Game type | Common pressure point | What to watch |
|---|---|---|
| Minecraft Java, small vanilla SMP | CPU during chunk generation and player peaks; RAM if heap is too small | TPS, chunk loading, lag spikes, RAM limit hits |
| Minecraft Java, heavy modpack | RAM first, then CPU during generation and automation | RAM usage, startup memory, lag spikes, tick time |
| FiveM light server | CPU, especially script pressure | hitch warnings, slow scripts, CPU pinning |
| FiveM heavy RP server | CPU or RAM depending on script quality | hitch warnings, memory leaks, database latency |
| Rust | RAM and CPU, depending on map size and entity count | RAM growth, save spikes, CPU during peak population |
| Valheim | CPU and RAM both matter as world complexity grows | simulation load, save behavior, RAM growth |
| ARK-style survival servers | RAM, storage, and CPU spikes | save size, mod count, restart behavior |
The biggest mistake is assuming the game name alone tells the full story. A clean FiveM server and a messy FiveM server are not the same workload. A vanilla Minecraft SMP and a 250-mod kitchen-sink pack are not even close.
Practical Capacity Rules for New Hosts
If you are starting a game server hosting business, use this as your first operating policy:
- Install monitoring before selling aggressively. Netdata is enough to start. Prometheus and Grafana can come later.
- Keep spare capacity on purpose. Early on, stop new placements before the node is actually full. A 15-20% buffer is boring until the first incident saves you.
- Measure for 2-4 weeks. You need peak behavior, not a random afternoon screenshot.
- Adjust the blocking resource carefully. If RAM allocation blocks placement and memory pressure is clean, adjust RAM overcommit carefully. If CPU allocation blocks placement and game health is clean, adjust CPU policy carefully.
- Separate heavy workloads. Heavy modpacks and heavy FiveM RP servers deserve stricter placement rules.
- Document every ratio change. If performance gets worse, you need to know what changed.
- Keep fleet spare capacity too. If you promise migrations or failover, leave enough room on other nodes to handle that promise.
- Alert before customers do. A Discord webhook is better than learning about node pressure from an angry ticket.
Resource starvation is not a catastrophe. It is a signal. It tells you your plan ratios, allocation rules, or workload mix do not match the way customers actually use the hardware.
The hosting businesses that understand this get better margins without destroying performance. The ones that do not either leave money on the table or oversell blindly and wonder why customers leave.
Need a website for your hosting business?
If your infrastructure is sorted but your website still needs work, check out Latch, the Next.js template I built specifically for game hosting companies. It includes hosting pages, game pages, pricing sections, and a structure made for game server SEO.
Written by
Yuvraj Verma
Yuvraj Verma writes practical guides on hosting, monetization, and game server infrastructure.
His content is built to help creators and hosting businesses launch faster with fewer mistakes.
Next articles
Read these next
Latch: The Next.js Website Template for Game Server Hosting Companies
Latch is a premium Next.js 16 website template built for game hosting, VPS, and dedicated server businesses. 15+ pages, config-based setup, 95+ Lighthouse score. Launch your hosting site in hours.
Open articleZAP-Hosting ZapX: Full Rebuild and AI Server Assistant Explained
ZAP-Hosting has announced ZapX, a full rebuild with a new website, new dashboard, and optional AI assistant for logs, configs, mods, VPS commands, and DNS.
Open articleGame Server Hosting in India: The Honest Reality Nobody Talks About
A deep research piece on game server hosting in India in 2026. Written from 6 years of personal experience running FiveM and Minecraft servers. For Indian players, server owners, and hosting companies thinking about entering this market.
Open article